
Multi-channel sales analytics prototype
Retail Analytics Prototype
A working prototype unifying multi-source retail sales data into sales, product strategy, and pack coverage dashboards for an SMB retail and e-commerce client.
Overview
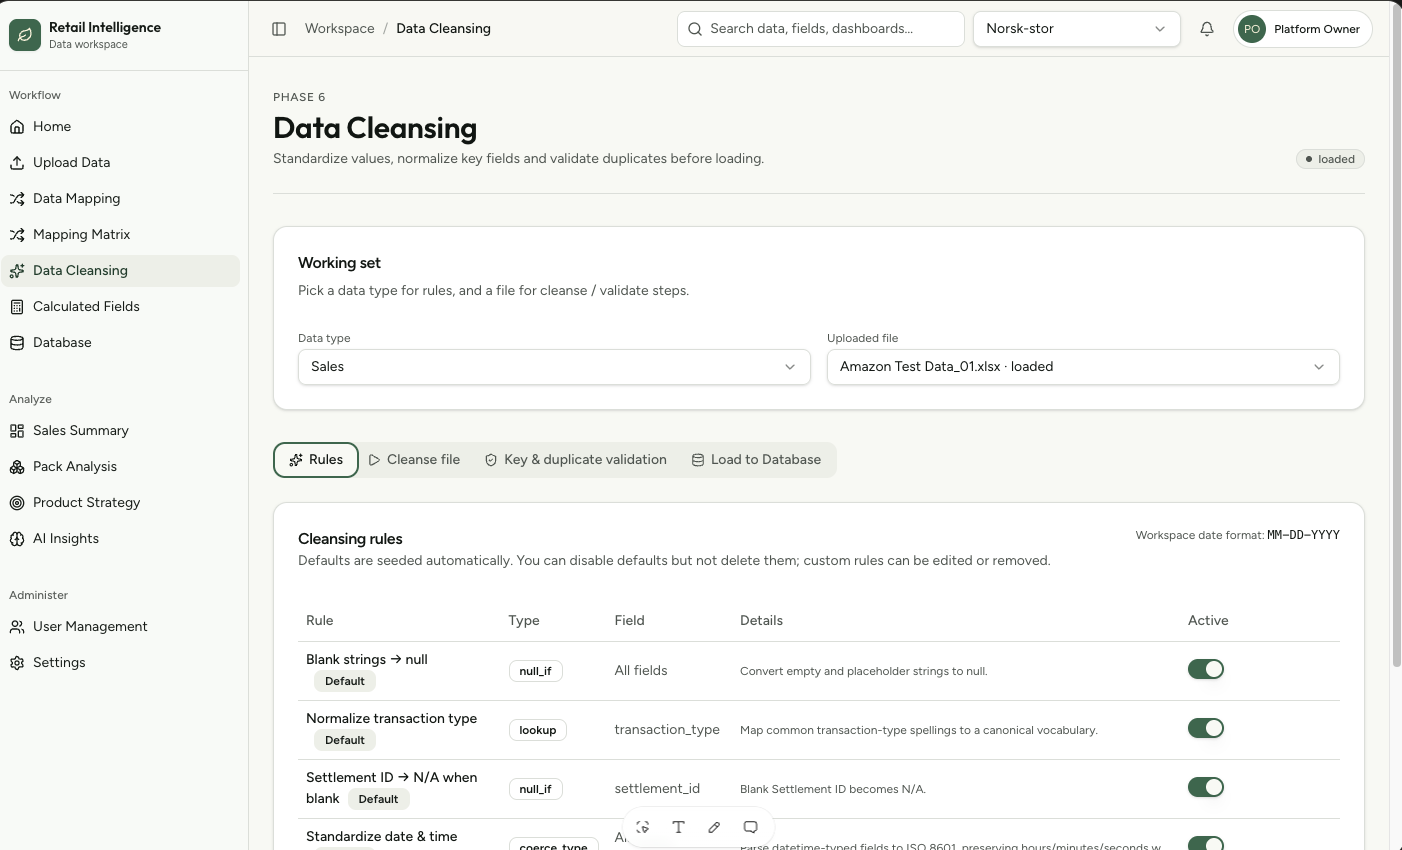
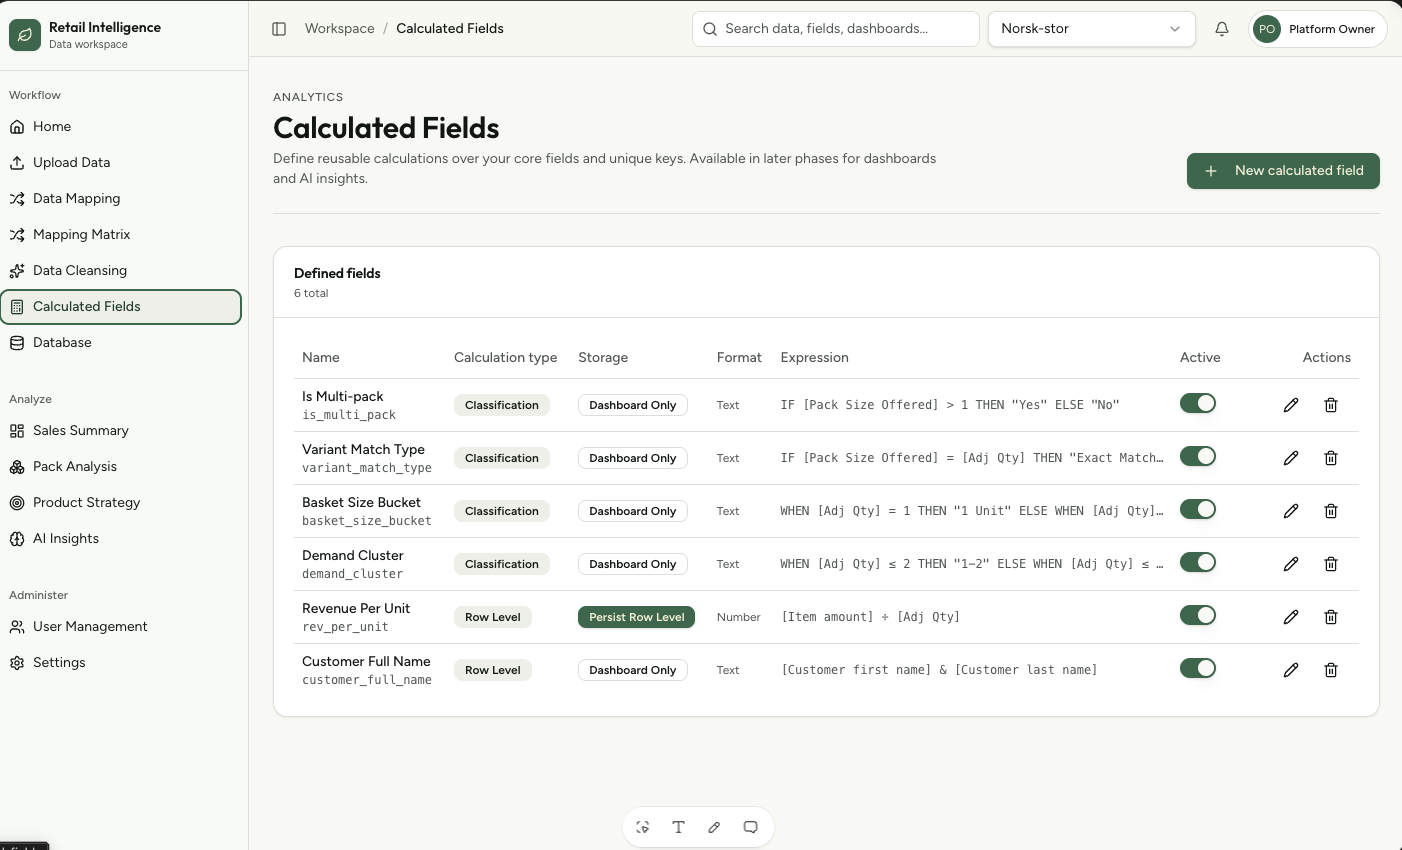
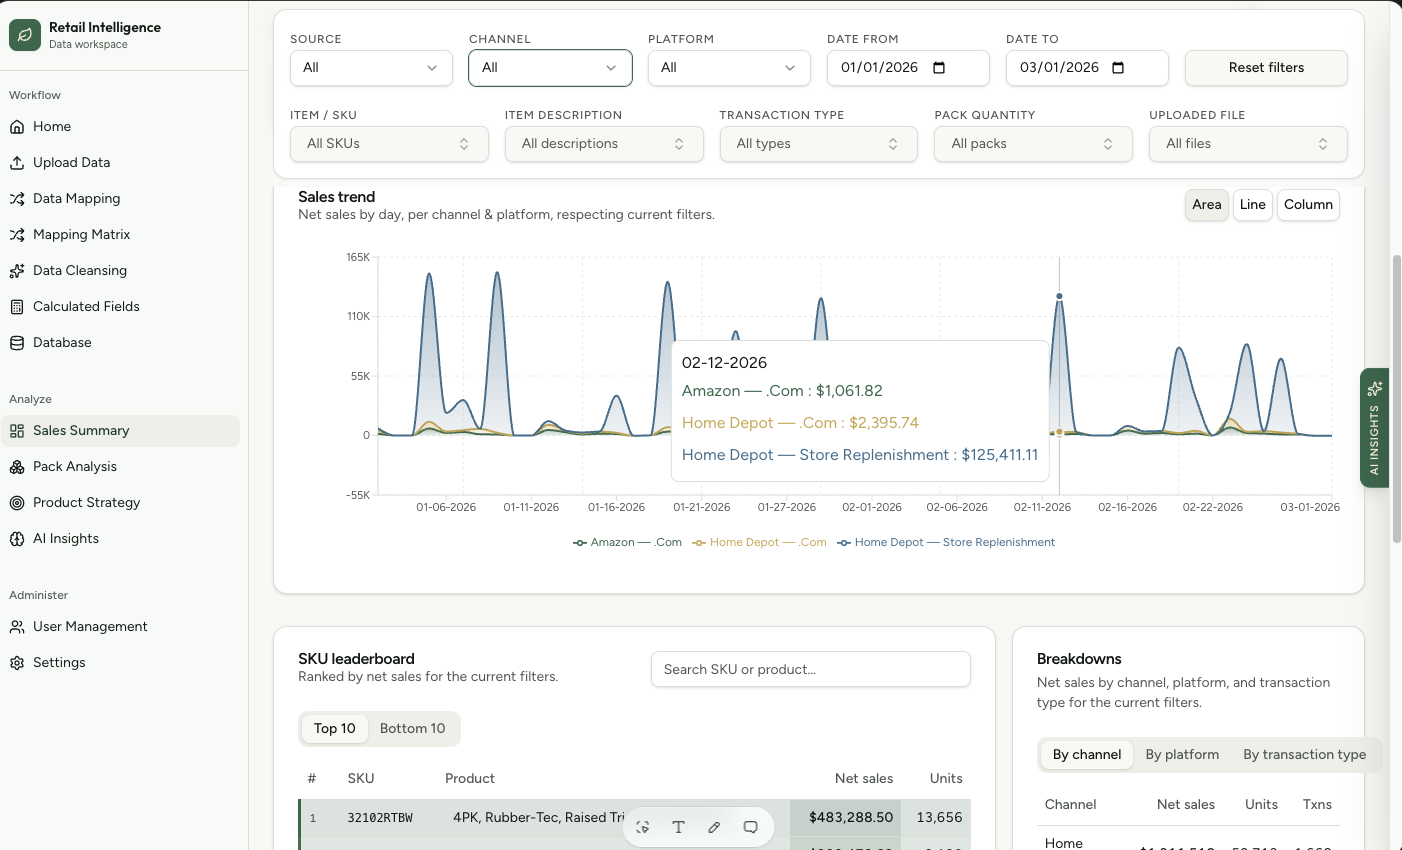
A multi-channel sales analytics prototype built for an SMB retail/e-commerce client — a flooring products business selling through several large retail and marketplace channels. The goal was a single, trustworthy view of sales performance across sources that report data in incompatible ways.
Problem
Each sales channel exported data with a different shape, different field names, and different notions of what a transaction even is. Analysts were reconciling spreadsheets by hand. Worse, early dashboard work inherited a subtle failure: coverage indicators described what a mapping table claimed was available rather than what the data actually contained, so users were told fields were missing when they were populated — and told fields were present when every row held a placeholder value.
Approach
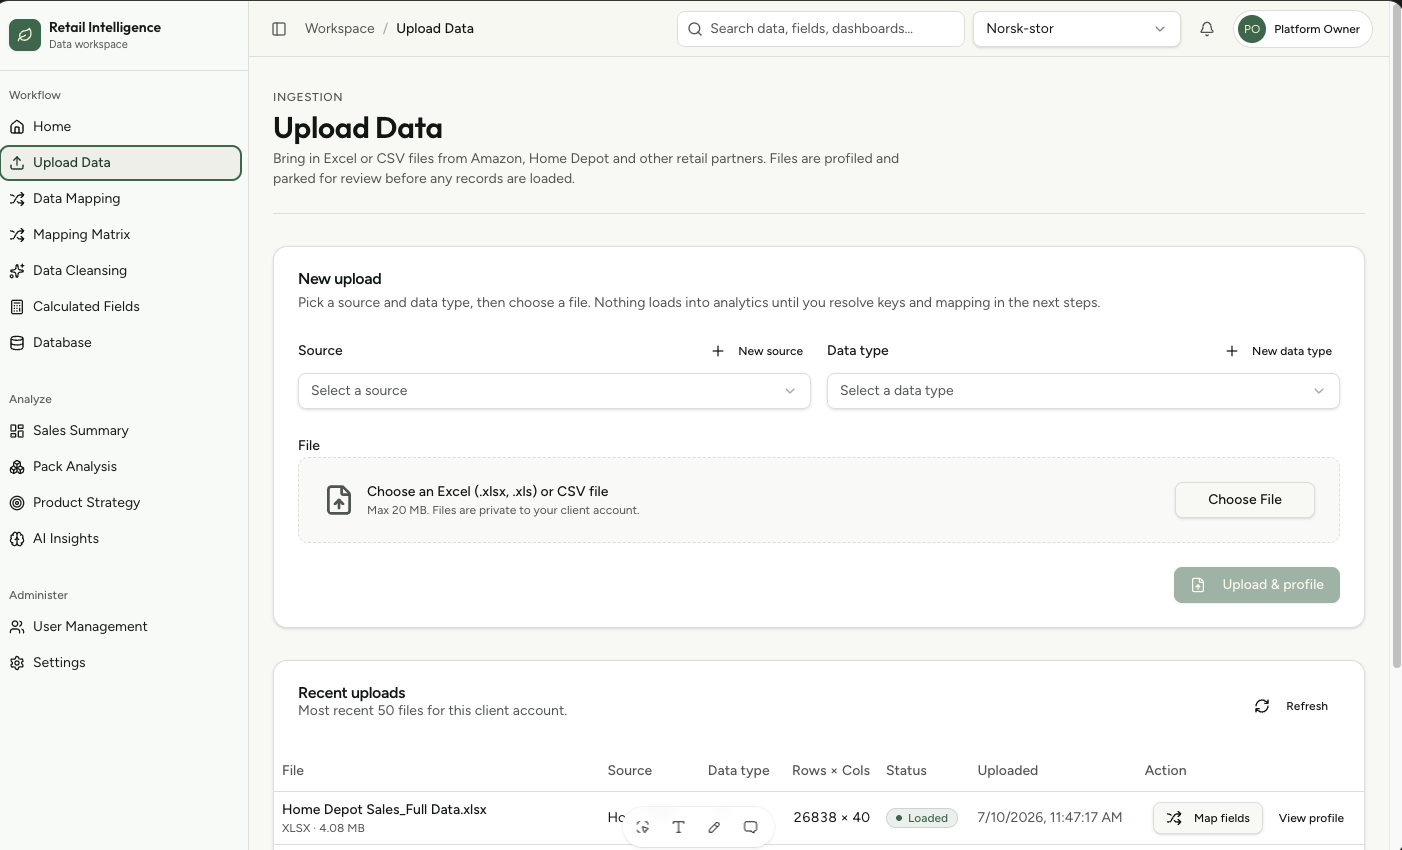
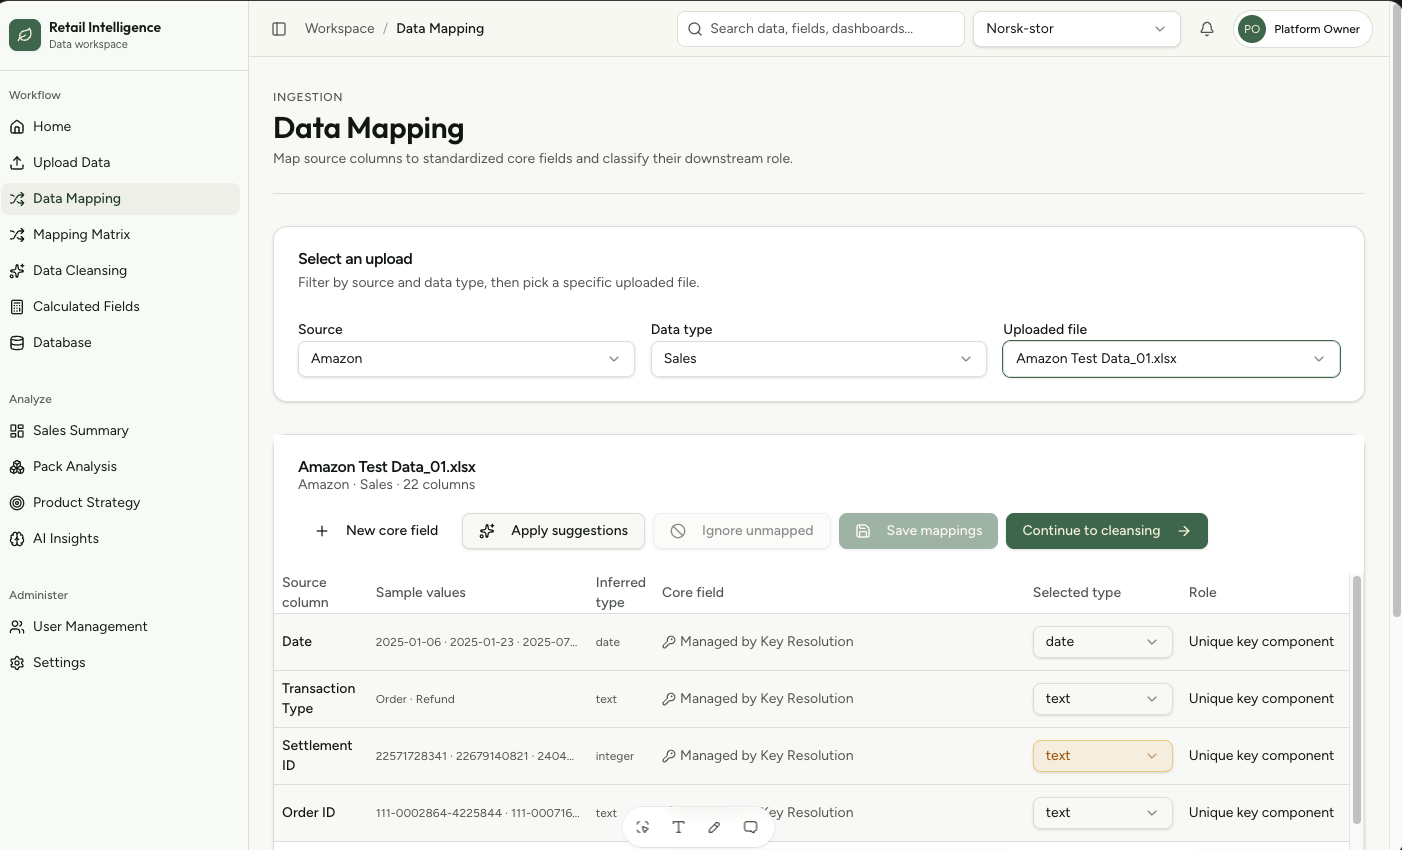
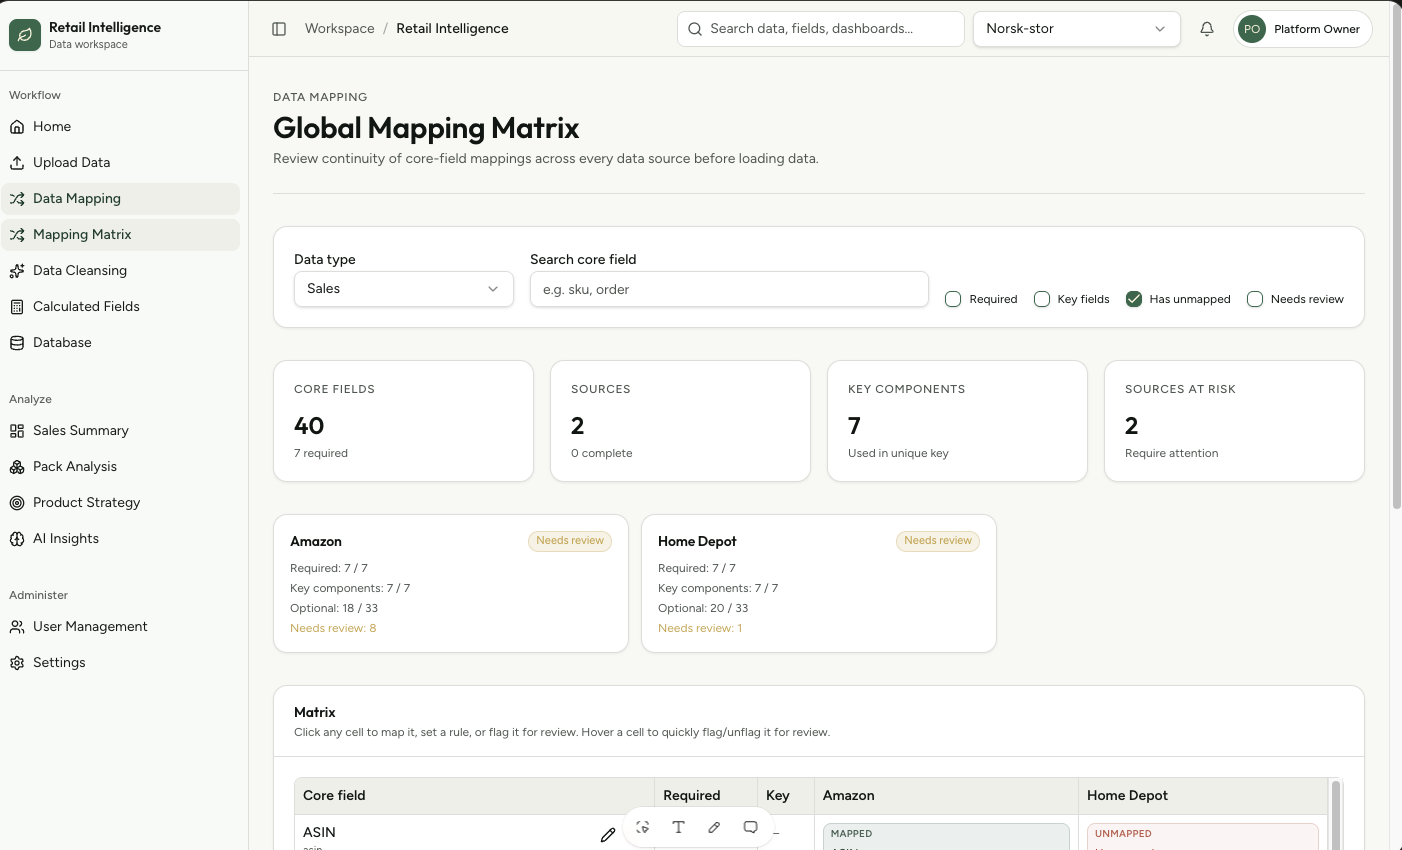
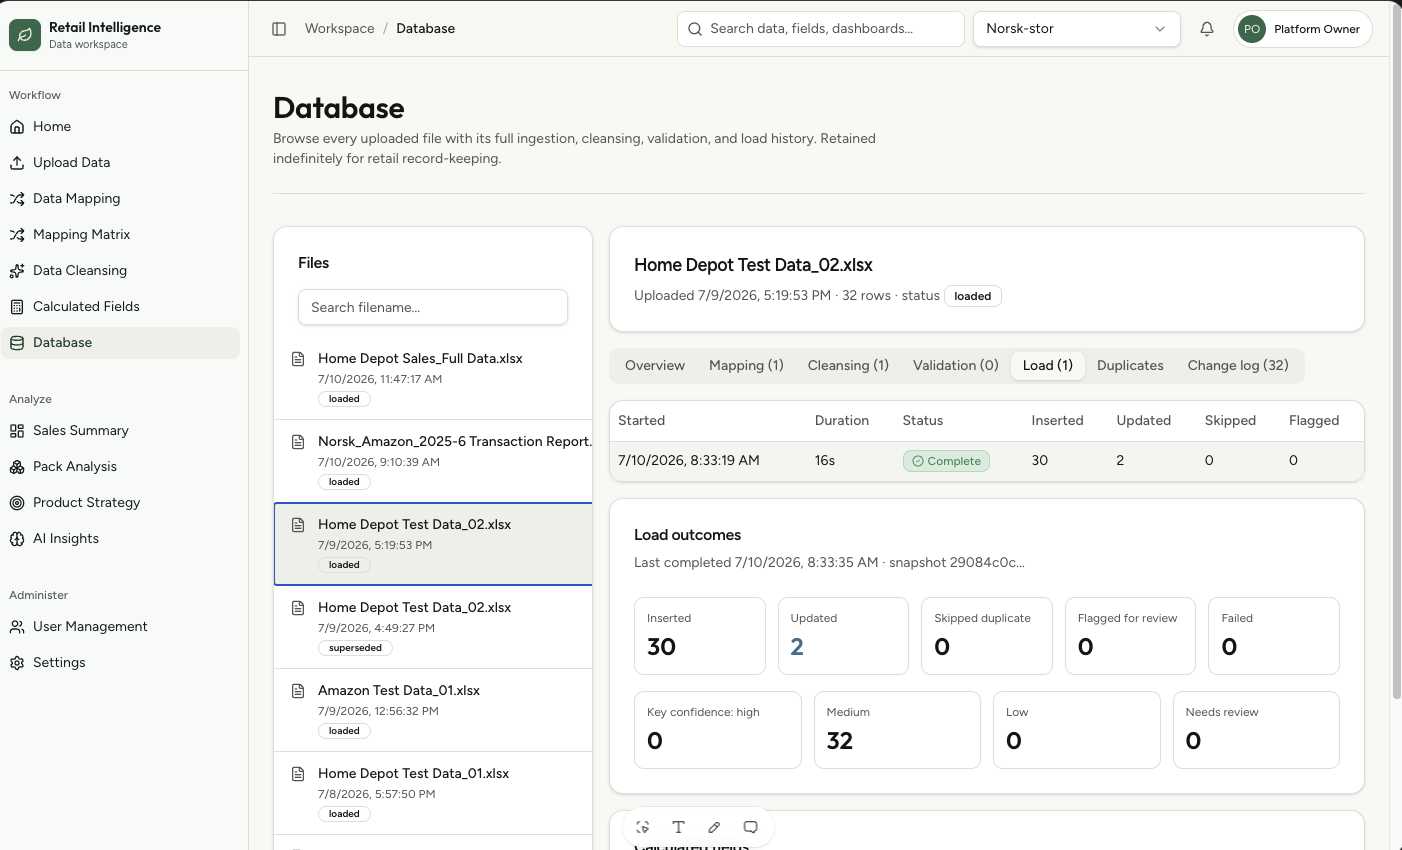
Model the data before building the dashboards. Sources were normalised into a shared fact table with explicit dimensions for channel, platform, transaction type, and pack configuration. Then coverage was re-grounded: a field counts as available for a source only when real rows hold real values, with nulls, blanks, and sentinel placeholders like "NA" all treated as missing.
Solution
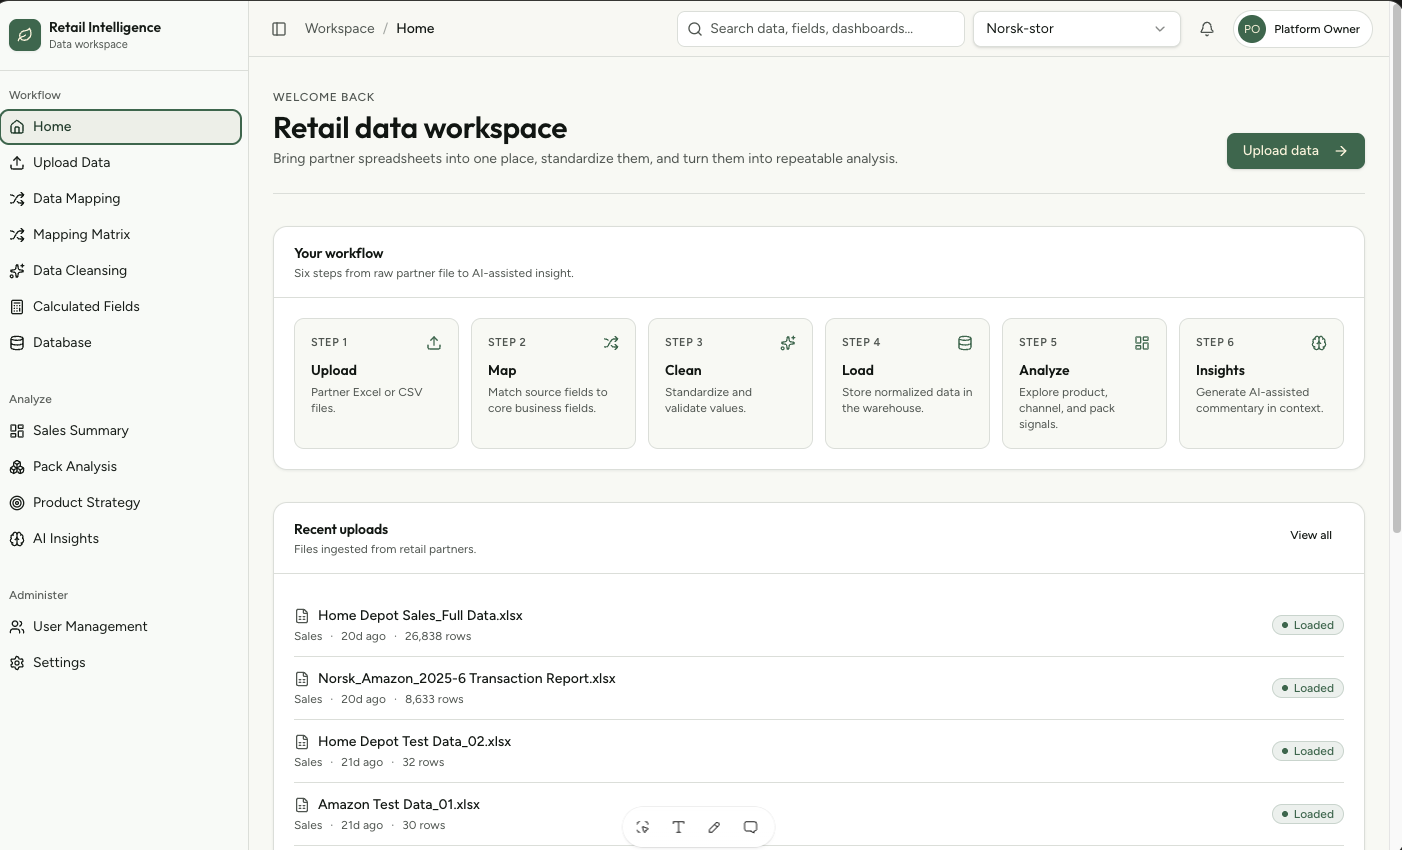
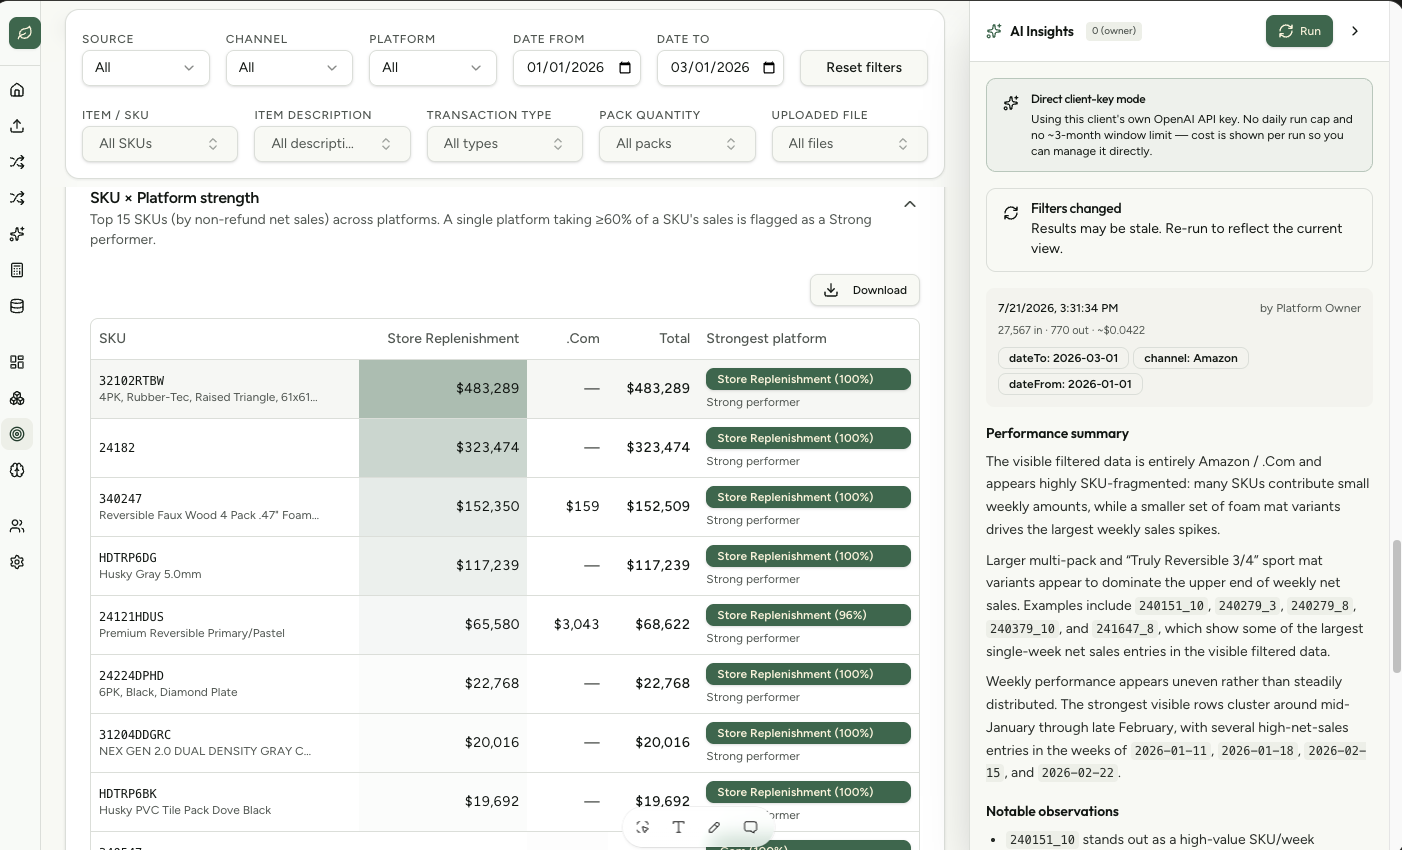
Dashboards for sales summary, product strategy, and pack analysis, sitting on a normalised multi-source warehouse. Coverage banners on each dashboard tell the user honestly which fields are backed by real data per source, computed with a single shared helper so every module agrees on the rules.
Tools / Methods
Dimensional data modelling, ETL and source normalisation, Postgres, analytics dashboard design, data quality and coverage instrumentation.
Outcome or Current Status
Prototype in active use for analysis. Coverage reporting now matches what the dashboards actually render, and adding a new sales source is a mapping exercise rather than a rebuild.
What This Shows
That most analytics problems are data architecture problems wearing a dashboard costume — and that a BI surface which lies about its own completeness is worse than no dashboard at all.
Related services